Scientists receive little to no training on the best practices of research data visualization so we do the natural thing – check out how our predecessors have dealt with it in their research papers. Then we set this as the benchmark.
Well, guess what! Most of our fellow researchers also do not have a clue about the best principles of research data visualization. And so the perpetual cycle of notoriously bad data charts in research papers lives on. This is unfortunate because research data visualization is one of the keys to communicating scientific results.
In this article, you will learn about different research data visualization apps, helpful websites that aid in chart creation, and you will be able to download a data visualization cheat sheet. Here is the structure of this article:
Selecting the best chart type for research data
Plotting freshly baked research results into different types of charts is my favorite part of being a researcher. But it’s not easy to do it right. When I open MS Excel or any other data visualization app, I see a plethora of options to choose from.
Knowing that there are many different types of charts is good, but it can also be confusing. For example, here is a very basic question. Should I use a pie chart or a bar chart for the data?
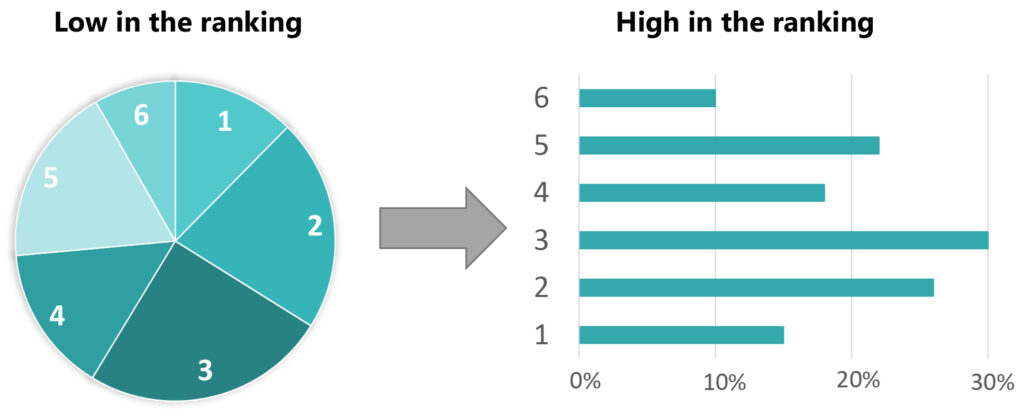
In this case, the answer is quite simple – use the bar chart.
Why?
Take a look at the figure above. You will agree that it is much easier to compare lengths of bars than it is to estimate the angles (or areas) that are required to weigh categories in the pie chart.
In most cases, though, the choice will be more difficult. In the past, to select the best chart I would first test ten different charts for exploring what it is that the data is trying to tell me. Once I had decided on the chart, I would bend over backward to make sure I polish it in a way that best presents my research data to others.
This felt like a maze.
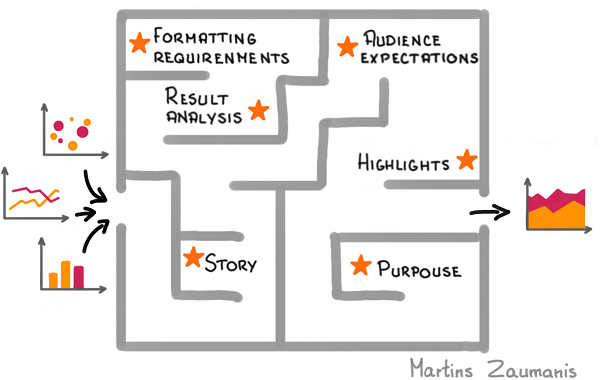
After many years of struggling like this, I developed an eight-step system for designing scientific charts. Following these eight progressions will help you to first select the chart type and then polish it to make sure tells a clear story. Download the eight-step research data visualization cheat sheet below.
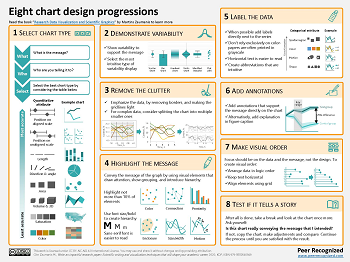
This data visualization cheat sheet is not based on my experience alone. It draws on various research studies that have explored how humans perceive visual information and translate it into quantities.
My book book “Research Data Visualization and Scientific Graphics” explains each of the eight chart design progressions from the cheat sheet in detail. To make the concepts tangible, in the book I offer many examples from scientific papers for how to create effective research data visualizations. Importantly, the book also includes examples of what not to do.
To help you decide between the different chart types, you can also visit any of the following three websites. The websites offer some advice about the best uses of each chart.
https://depictdatastudio.com/charts/


Software for research data visualization
Below is a great table summarizing different research data visualization apps that I borrowed from a paper by O’Donoghue et al. The software in this table is arranged in approximate order, starting from easy-to-use apps for one-off data visualizations and progressing to apps that require more user experience but can process large, complex research data.
| App | Description | Link | Cost |
| Excel | A well-known software for visualizations of small data sets | http://microsoft.com/excel | Yes |
| Plotly | Online data visualization app | https://plot.ly/create | Free |
| Tableau | A tool for interactive data visualizations, including a web-based interface | http://tableau.com | Yes |
| Spotfire | Software for visual analysis of larger research data sets and tool generation | https://spotfire.tibco.com | Yes |
| Origin | An app for visual analysis of larger data sets | http://originlab.com | Yes |
| Mathematica | Software for visual analysis of research data sets and mathematical functions | https://www.wolfram.com | Yes |
| MATLAB | Powerful software for visual analysis of research data sets and mathematical functions | http://mathworks.com | Yes |
| Matplotlib | An app for tailored visualizations of research data sets in Python | http://matplotlib.org | Free |
| ggplot2 | A tool for tailored visualizations of large, complex data sets in R | https://ggplot2.tidyverse.org | Free |
| D3.js | Software for tailored, interactive web-based data visualizations | https://d3js.org | Free |
Apps for post-processing of scientific charts
Regardless of which one of the many research data visualization apps you use, it may not be able to accomplish quite what you have imagined. For example, adding legends in a specific way, overlaying several charts, or editing a specific part of the data chart. In those cases, you can use chart post-processing tools.
I have found that exporting (“printing”) a data chart as a PDF document and then editing it using Adobe Illustrator is extremely useful. Sometimes Photoshop can help as well. Below are links to these apps as well as open-source alternatives. Open-source means free, and these apps offer almost all the functionality as their paid counterparts (and sometimes even more).
| Software | Description | Link | Cost |
| Photoshop | A popular app for editing images | http://adobe.com/photoshop | Yes |
| GIMP | Open-source alternative to Photoshop | http://gimp.org | Free |
| Illustrator | A software for creating and editing vector graphics | http://adobe.com/illustrator | Yes |
| Inkscape | Open-source alternative to Illustrator | http://inkscape.org | Free |
Be careful when editing research data charts to make sure that data integrity is not compromised. For example, do not change the scale of axes or scale separate data bars.
Choosing a color palette for data visualizations
Color should have a specific task in data visualization. This task is not to make a chart look pretty, in case you were wondering.
Here are some uses of color in data charts that are reasonable:
- Differentiating between categories of results;
- Highlighting important elements in the data chart;
- Assigning a particular color to a certain result in series and keeping it consistent throughout all the data charts in a research paper or a scientific presentation.
These are examples of using color for categorizing or highlighting elements in data visualizations. But it is even more important to select color properly when using it for conveying quantitative data through a chart. Such an approach is often necessary for research disciplines like microscopy, climatology, molecular biology, and cartography.
There are multiple significant problems associated with using color to represent quantities. They are so persistent that the data visualization pioneer E.Tufte once wrote:
“Avoiding catastrophe becomes the first principle in bringing color to information: Above all, do no harm”
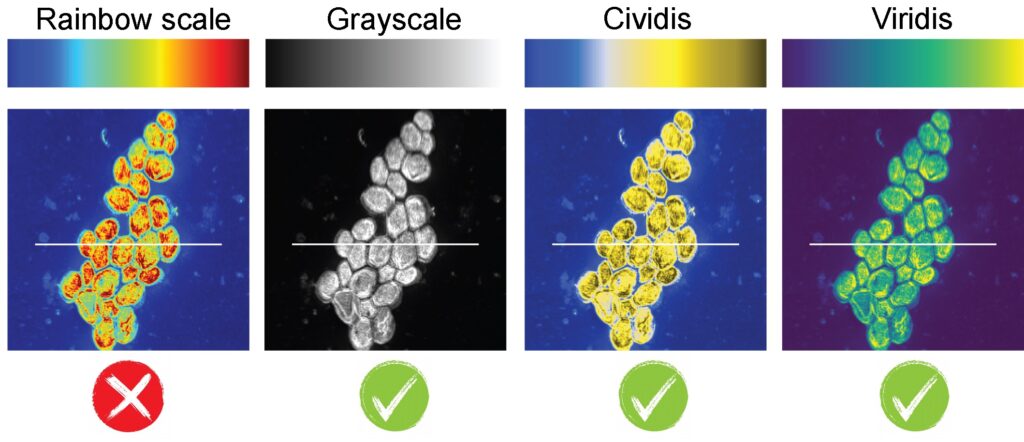
See below one of the problems. Without looking at the scale, can you tell if blue is higher or lower than green in the data chart? What about yellow?

People generally do not assign a ranking to colors. It is impossible to tell if orange is a higher number than blue.
The best way to avoid this problem is to use color scales that have been designed specifically for conveying quantitative data, like Cividis or Viridis. See in the Figure just how much more intuitive these scales feel compared to the rainbow scale used in the first data chart.
Thankfully, scientists don’t have to go to an art school to learn about the use of color in data visualizations. The table below offers tools that will help you in selecting color scales for your research data charts
| Resource | Description | Link | Cost |
| Color Brewer | Web tool for selecting contrasting color maps | http://colorbrewer2.org | Free |
| Adobe Color | Web tool for designing sets of colors | http://color.adobe.com | Free |
| Paletton | Web tool for designing sets of colors | http://paletton.com | Free |
| Matplotlib | A software extension that holds many readily available colormaps for Python | https://matplotlib.org/ | Free |
| Kenneth Moreland | A website that offers different color maps with a code generator. | https://www.kennethmoreland.com/color-advice/ | Free |
A practical guide for creating charts and graphics
In this article, I offered you different software and other tools for research data visualization. But being able to use a particular software is not the same thing as knowing how to create a convincing research data visualization. You have to learn about ways to select the right type of chart, format it so that the key message stands out, and demonstrate variability, among other things.
Clear charts and informative graphics draw citations to papers, make presentations memorable, and encourage reviewers to approve research proposals. My online course “Research Data Visualization and Scientific Graphics” will show you how to create data visualizations that tell a story in 8 straight-forward progressions.

Author

Hey! My name is Martins Zaumanis and I am a materials scientist in Switzerland (Google Scholar). As the first person in my family with a PhD, I have first-hand experience of the challenges starting scientists face in academia. With this blog, I want to help young researchers succeed in academia. I call the blog “Peer Recognized”, because peer recognition is what lifts academic careers and pushes science forward.
Besides this blog, I have written the Peer Recognized book series and created the Peer Recognized Academy offering interactive online courses.


One comment