Most people quickly browse a research paper before deciding if they want to invest time in reading it. Great scientific illustrations are one of the keys that can turn the decision in your favor.
Here are two ways of explaining what DNA is. Which one do you think will attract more attention? Which one is easier to perceive?
Explanation No.1: This polymer is made of a double-stranded tertiary molecular structure with sugar-phosphate backbone to which base pairs consisting of four chemical bases (adenine, guanine, cytosine, and thymine) are attached.
Explanation No.2:
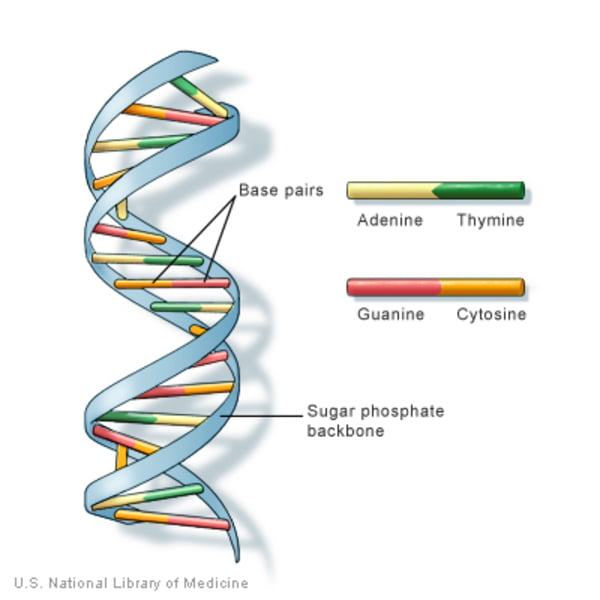
As you can see from the DNA example, a scientific illustration can be a very powerful means of explaining scientific principles. For example:
- A visualization can allow demonstrating scientific models and replace photographs (e.g. when it is impossible to make photography).
- A schematic can draw attention to the key components of a device.
- A good flow chart can allow the viewer to quickly understand a research methodology.
Whether it is a research paper, a conference presentation, a research proposal, or a classroom lecture, diagrams, schematics, drawings, images, and other forms of scientific illustrations are all an important part of academic communication.
Let’s look at the tools that will help you to develop scientific illustrations.
Creating 2D images
Adobe Illustrator is the go-to software many professionals use for creating and editing vector graphics. In case you are not familiar with the term, vector graphics refer to images that are defined in terms of points and lines, rather than static pixels of color like it is in raster graphics. This has the advantage that images can be scaled up without becoming blurry. Many journals prefer the illustration to be created this way and it will also come in handy when you want to show an image on a big screen at a conference. Cost: Yes.
Inkscape is an open-source alternative to Illustrator and it can do many of the same things without breaking the bank. There is also a strong Inkscape user community for when you hit a wall. Cost: free.

VectorStock offers a large selection of vector images that you might use for your illustrations, posters, social media updates, and the like. Being vector graphics, you will be able to modify them using the tools above.
Mind the graph is a platform for medical scientists and life sciences in general. It offers icons and various scientific illustrations that you can mix and use for papers, presentations, teaching, or creating infographics. Cost: yes.
Bio Render is similar to Mind the Graph and offers many icons that are purposefully designed for life sciences. You can drag and drop them to create your own scientific illustration. Cost: yes.
Adobe Sketchbook is a free drawing software by Adobe. It is especially nice if you own a digital drawing pad or a tablet. I used Sketchbook for creating all the illustrations for the Peer Recognized series books. Cost: free.
Krita is an open-source alternative to Adobe Sketchbook. Cost: free.
Creating 3D images
A scientific illustration in 3D can add a sort of a “reality feeling” to a concept that you are presenting. It will also come in handy in cases when making photography is difficult or simply impossible.
3D visualizations can be especially useful in life sciences and biomedical science in particular. That is why in this list I included some extensions that can greatly simplify the visualization.
Maya is a professional-grade software for creating 3D images, rendering, and animation. Cost: a lot
Molecular Maya is an extension of Maya that is designed for modeling and animating molecular structures. Cost: free, but there are add-on kits that do have a cost

Blender animation suite is an open-source alternative for Maya. Cost: free
Bioblender is a molecular structure plug-in for Blender. Cost: free
There are, of course, many more 3D apps, including Solid Edge and 3ds Max that might be useful. Mostly the choice depends on which program you have experience with because even the best software will do you no good without an adequate skill set. The availability, of course, is another important aspect, because most 3D modeling programs can be pricy.
Make your research stand out using my Scientific Visualization Cheat Sheet.
Good visuals make your papers get noticed and presentations remembered. The Cheat Sheet will help you make this happen.
Tools for creating diagrams, posters, and infographics
Adobe InDesign is the go-to app professionals use for designing pages and creating graphics. This makes it very useful for creating professional-looking posters, flow-charts, and infographics.
Publisher is Microsoft’s version of page layout design software. Due to the general familiarity with Microsoft’s products, many might find it more intuitive than InDesign. Besides, it is quite possible that it already is installed on your PC. Cost: yes.
PowerPoint quite often might be the only tool you need for creating simple diagrams, infographics, and posters. I have used it for most of my posters. Cost: yes
MS Visio is designed for creating complex diagrams and flow-charts. Although my flow-charts are quite simple, I use it as well because, from any of the Microsoft products, it does the job the best. Cost: yes, but it may already be on your PC.
Canva offers many stylish templates for creating infographics, posters, and illustrations for presentations. Cost: There is a free version and a premium upgrade with a larger library of images. I have found that the free version is enough, especially since I most often I use my own images.
Piktochart is similar to Canva as it allows the creation of infographics, posters, presentations, and graphics for social media. Cost: yes
Tools for editing and analyzing images
ImageJ is a Java-based open-source image processing software that was developed by the National Institutes of Health. It offers a wide functionality for analyzing and processing scientific images. There are many free plugins available, which might help you with many tasks. Plus, it has gathered a community of fans, so when you hit a roadblock, there is most likely someone who already found a way around it. Cost: free
Photoshop is perhaps the most powerful tool for editing images, and scientific illustrations are no exception. But remember there is a reason why “photoshopping” is used with a negative connotation nowadays. When creating scientific illustrations, you have to be unbias and disclose all the edits to images (e.g. microscopy images). Cost: yes.

GIMP is an open-source alternative to Photoshop. Many third-party plugins are available, that might help you with whatever task you have. Cost: free.
How to find free scientific illustrations
In many cases, you may not need to create your own illustrations. Someone might have already created an image that would be perfect for you. In some other cases, you might want to make some tweaks to an existing image using one of the image editing apps we looked at earlier.
The problem is, you are not allowed to simply use whatever you find online. Images are by default protected by copyright and you need permission from the author to re-use them publicly. Fortunately, many people choose to make their work publicly shareable.
Here are some tools that allow to find images that you can reuse freely. Check the license though. Even if you are allowed to re-use them, in most cases you are obliged to give attribution to the author.

NOA is a search engine built specifically for scientific illustrations. Its collection is made of millions of images from open-access journals. Before using them, though, double-check the license on the webpage of the corresponding paper.
PDB-101 stands for Protein Data Bank entry-level (101). It offers free-to-use visualizations of biomolecular structures and their functions.

Creative Commons is a non-profit organization that works to enable sharing of different types of creative works that normally would be copyrighted by default. It also offers a search engine for searching free-to-use images.
Unsplash offers a selection of generic photographs that the authors have chosen to make freely available to everyone. Even attribution is not mandatory, but of course, the authors will appreciate it. The photographs might come in handy in presentations, for example, to show a real-world example of a problem that you are solving with your research.
Pexels offers a selection of free videos and generic photographs that can be useful for your scientific illustrations and scientific videos. I especially like the video section since searching with the appropriate keywords allowed me to find scenes from research life.
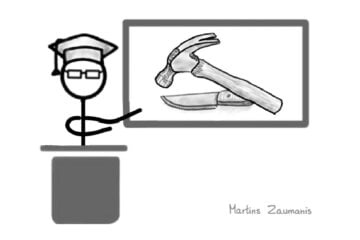
Tools without knowledge are of no use
Regardless of the tool you choose, it will only serve you if you really learn to use it. Even the most expensive software will be of little help if you have only a vague idea about its functionality.
And even if you do know the ins and outs of the software you want to use, you also need to be familiar with the basic principles of visual design. Otherwise, the result is likely not going to impress anyone.
I wrote the book “Research Data Visualization and Scientific Graphics” with a busy scientist in mind. It will show you step-by-step instructions for how to create figures for papers, presentations, and research proposals alike. To make sure you can efficiently apply tips, the book includes a cheat sheet with a list of graphical features that you can refer to whenever creating a new graphic, diagram, or illustration.
Even if you would like to outsource the task of creating your illustration, it will be useful to know the basics. Otherwise, conversations with the freelancers can turn out very one-sided (and not in your favor).
Outsourcing a scientific illustration
There is no shame in admitting that you just don’t have the skills to create the graphic that you would like to. And you don’t care or have enough time to learn it. Thankfully with the advance of freelancing platforms, it is quite easy to find someone who can do the job for you without breaking the bank.
Fiverr is a platform where you can find freelancers for many types of work, including the creation of illustrations. Every freelancer has a rating, so make sure to check their profile before handing out what is called a “gig”. https://www.fiverr.com/
Upwork is similar to Fiverr, except that you will create a description of the job first. Then the freelancers will place bids on it. Similar to Fiverr, check the rating of the people who are offering to do the work and don’t fall for the cheapest offer. To start you will have to create a profile: https://www.upwork.com/
Ideas for inspiration
In the end, let me share some very cool platforms that can serve as an inspiration for creating your own scientific illustrations.
Wehi-TV offers a stunning library of biomedical animations, GIFs, and images. https://www.wehi.edu.au/wehi-tv

Roche has created guided visualizations showing metabolic reactions as well as cellular and molecular processes. http://biochemical-pathways.com/
A practical guide for creating scientific illustrations
Informative scientific visualizations and clear graphics draw citations to papers, make presentations memorable, and encourage reviewers to approve research proposals. The book “Research Data Visualization and Scientific Graphics” will show you how to make it happen.
Hi! My name is Martins Zaumanis and I am obsessed with communicating science visually. But I know you are not, so I wrote a book that will show you eleven principles that you can use for turning your ideas into clear meaningful diagrams, and memorable scientific visualizations, even if you don’t possess the artistic gene. The book also holds a step-by-step guide for turning research data into meaningful charts. Go to Amazon to read a preview.
Author

Hey! My name is Martins Zaumanis and I am a materials scientist in Switzerland (Google Scholar). As the first person in my family with a PhD, I have first-hand experience of the challenges starting scientists face in academia. With this blog, I want to help young researchers succeed in academia. I call the blog “Peer Recognized”, because peer recognition is what lifts academic careers and pushes science forward.
Besides this blog, I have written the Peer Recognized book series and created the Peer Recognized Academy offering interactive online courses.

5 comments